Scrub 2000 to 2100 and read world population, CO2 in ppm and the temperature anomaly, each on its own plotted curve.
Anchors are UN-style population estimates, the observed Mauna Loa CO₂ record, and the 1850-1900 temperature baseline. Values between anchors are straight-line interpolations of those anchors, and anything past the last anchor is a projection, not a measurement.
| Year | Population (bn) | CO₂ (ppm) | Anomaly (°C) |
|---|
Every 10th year, plus 2025 and the selected year.

Millisecond stopwatch with lap splits, fastest lap and keyboard start/stop.

Body mass index plus basal metabolic rate, with the healthy weight range for your height.

Printable 5x5 bingo cards with a proper B-I-N-G-O number range and a matching call sheet.

Build a wedding budget by category, track what is paid, and see what is still owed.

Work out the deposit per month that lands on your goal on a given date, then see the projection and whether it is actually reachable.

Compare offers on true annual value once bonus, retirement match, equity, commute and cost of living are counted, not just the base number.

Rent against a mortgage with tax, insurance and maintenance over any horizon, with the break-even point and the cash out year by year.
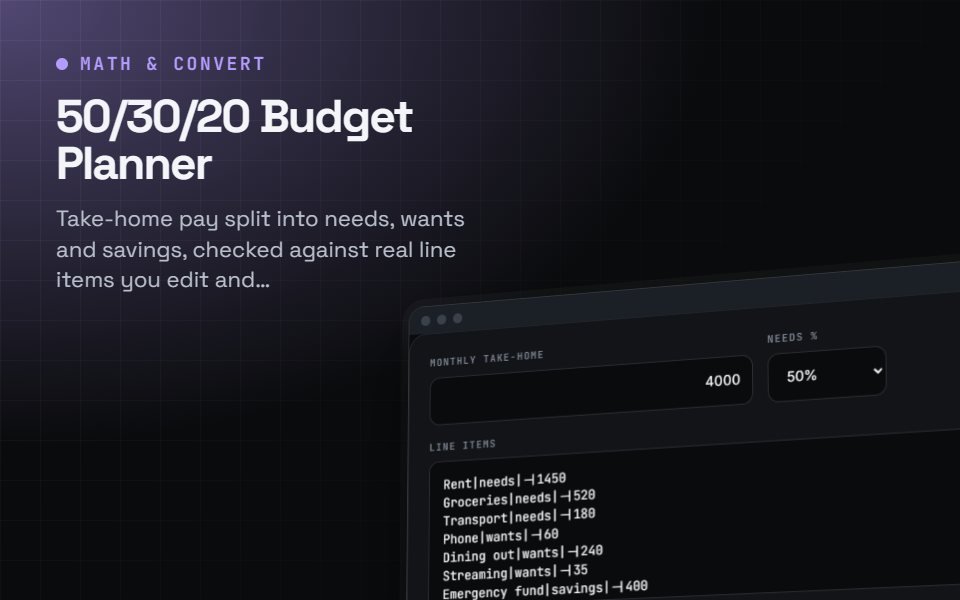
Take-home pay split into needs, wants and savings, checked against real line items you edit and rebalance as the rule changes.
